I have a kid now, and so do a few people I’ve worked closely with for years. We started talking about sampling bias—not in models, but in life. The neighborhoods we’re raising our kids in, places like Palo Alto and the Santa Monica Mountains, are extreme outliers. The people our children interact with every day are a narrow slice of the global population. That shared realization eventually turned into a question: what would it look like to generate a more honest sample of humanity—and what if you turned it into a game?
🎲 Using deterministic random seed: 1979🌟 Starting Program 1: Position Sampling and Data Fetching...📁 Using cached GeoTIFF: intermediate_files/pop_density.tiff🚀 Starting sampling of 9 positions...🎲 Sampling position and fetching data...🎲 Starting weighted random selection...📊 Retrieved data for DE: 📈 Economic: GDP/capita: $56103.7323182554, Population: 83516593 👥 Age: 0-14: 13.9101604189277%, 15-64: 62.8942524078782%, 65+: 23.1955871731941% 🌟 Social: Life exp: 80.5414634146342, Literacy: null%, Electricity: 100% 💼 Employment: Agri: 1.19870655264497%, Industry: 26.50471702511%, Services: 72.296576422245% 💰 Income: GNI PPP: $null, Gini: 32.4, Wage workers: 91.3725778418031%🗺️ Location details: Country: Germany, Continent: Europe, State: Hesse, County: Werra-Meißner-Kreis📡 Fetching Wage and salaried workers % (attempt 1/3): https://api.worldbank.org/v2/country/DE/indicator/SL.EMP.WORK.ZS?format=json&per...✅ Position sampling and data fetching complete!✅ Successfully fetched Gini coefficientThe idea first surfaced when a friend and longtime collaborator told me he’d been trying to make a game for his kids. The motivation was there, but the early results were unsettling. The sampling was honest, but not gentle: one of the first characters it produced was a visibly sad child in war-torn Ukraine. Others leaned uncomfortably into stereotypes. He builds games for kids all the time, and this felt different—not wrong, exactly, but revealing. The system wasn’t misbehaving; it was reflecting something real.
To deal with that, we started talking about history—not as a backdrop, but as a variable. The uncomfortable cards were snapshots, frozen at a single moment in time. But human societies aren’t static. Places that look prosperous today were often miserable in the past, and places struggling now have gone through long periods of stability, creativity, or power. Bringing in historical context let us shift from a flat sample of “now” to something longitudinal. It also opened a way to teach kids that human and cultural development isn’t a snapshot—it’s a time series.
Wikipedia felt like the obvious move. I’ve been reading history there for years, and it’s one of the few places where human knowledge is both deep and structured enough to be programmatically useful. The system starts by crawling Wikipedia’s historical eras portal and generating JSON files of eras across human history. When the sampler picks a location, it finds which eras align and uses those as structured seeds. By recursively walking category graphs and pulling summaries, the system generates people who make sense in their time: era-appropriate names, occupations, interests, stories, and images. Each era becomes a bounded distribution rather than a vibe, constraining technologies, social roles, and narratives. The LLM isn’t inventing history—it interpolates within it. History stops being static and becomes a generator, turning the game into a longitudinal model of humanity instead of a snapshot of the present.
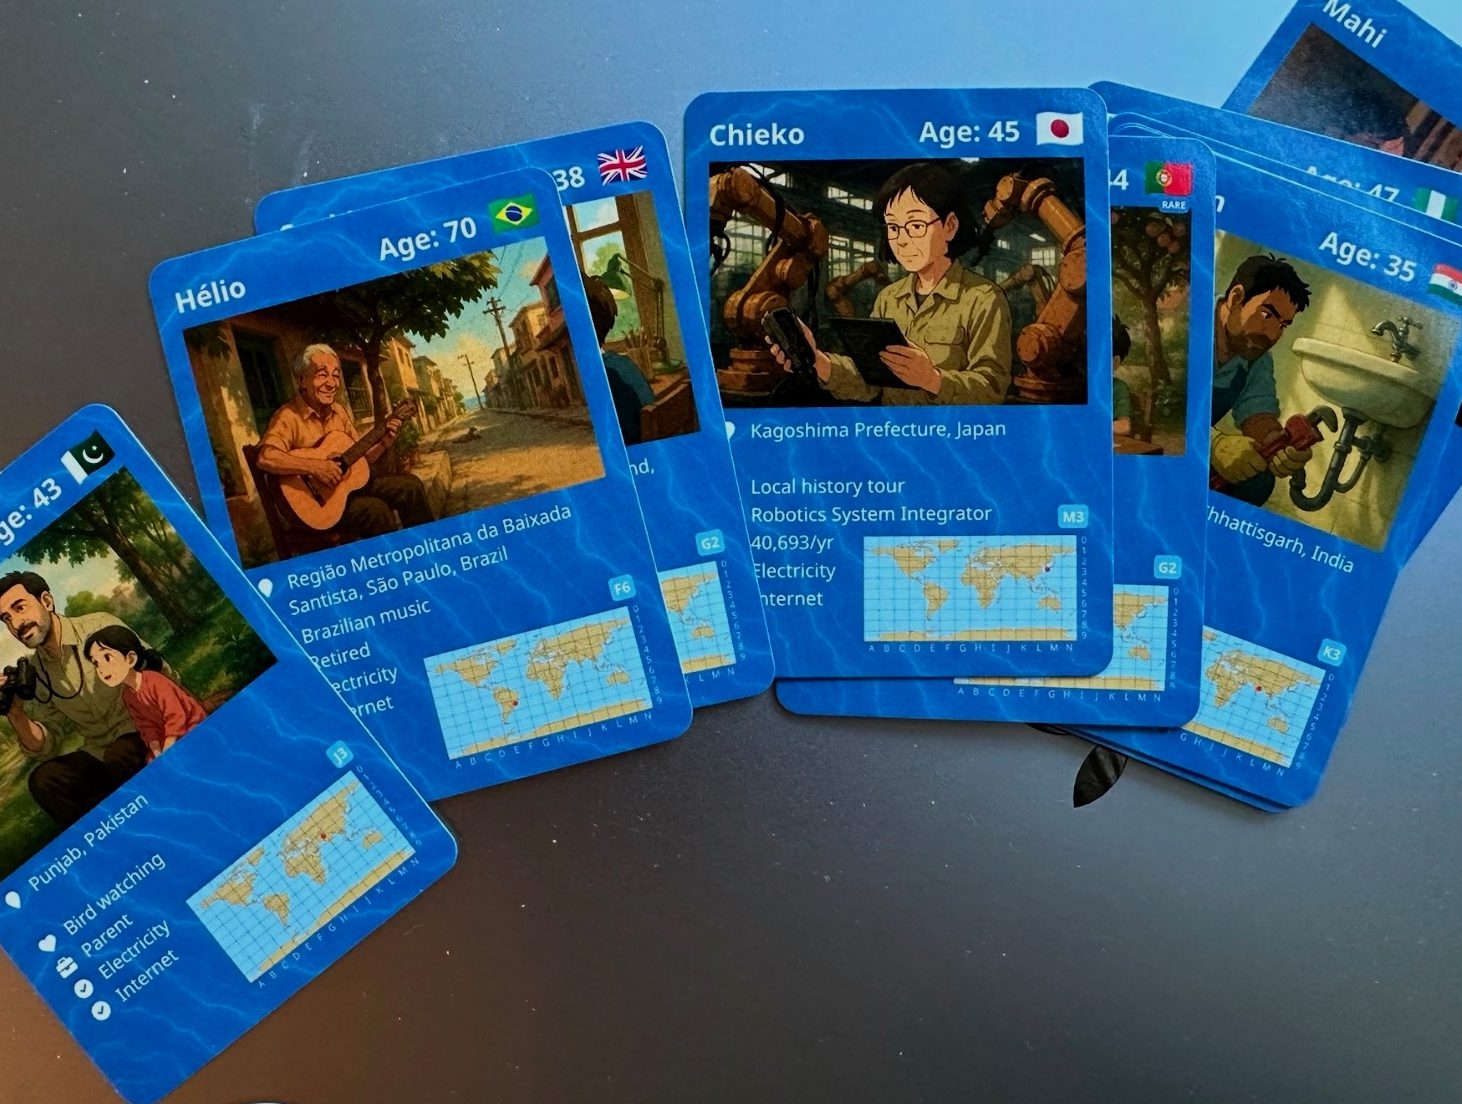
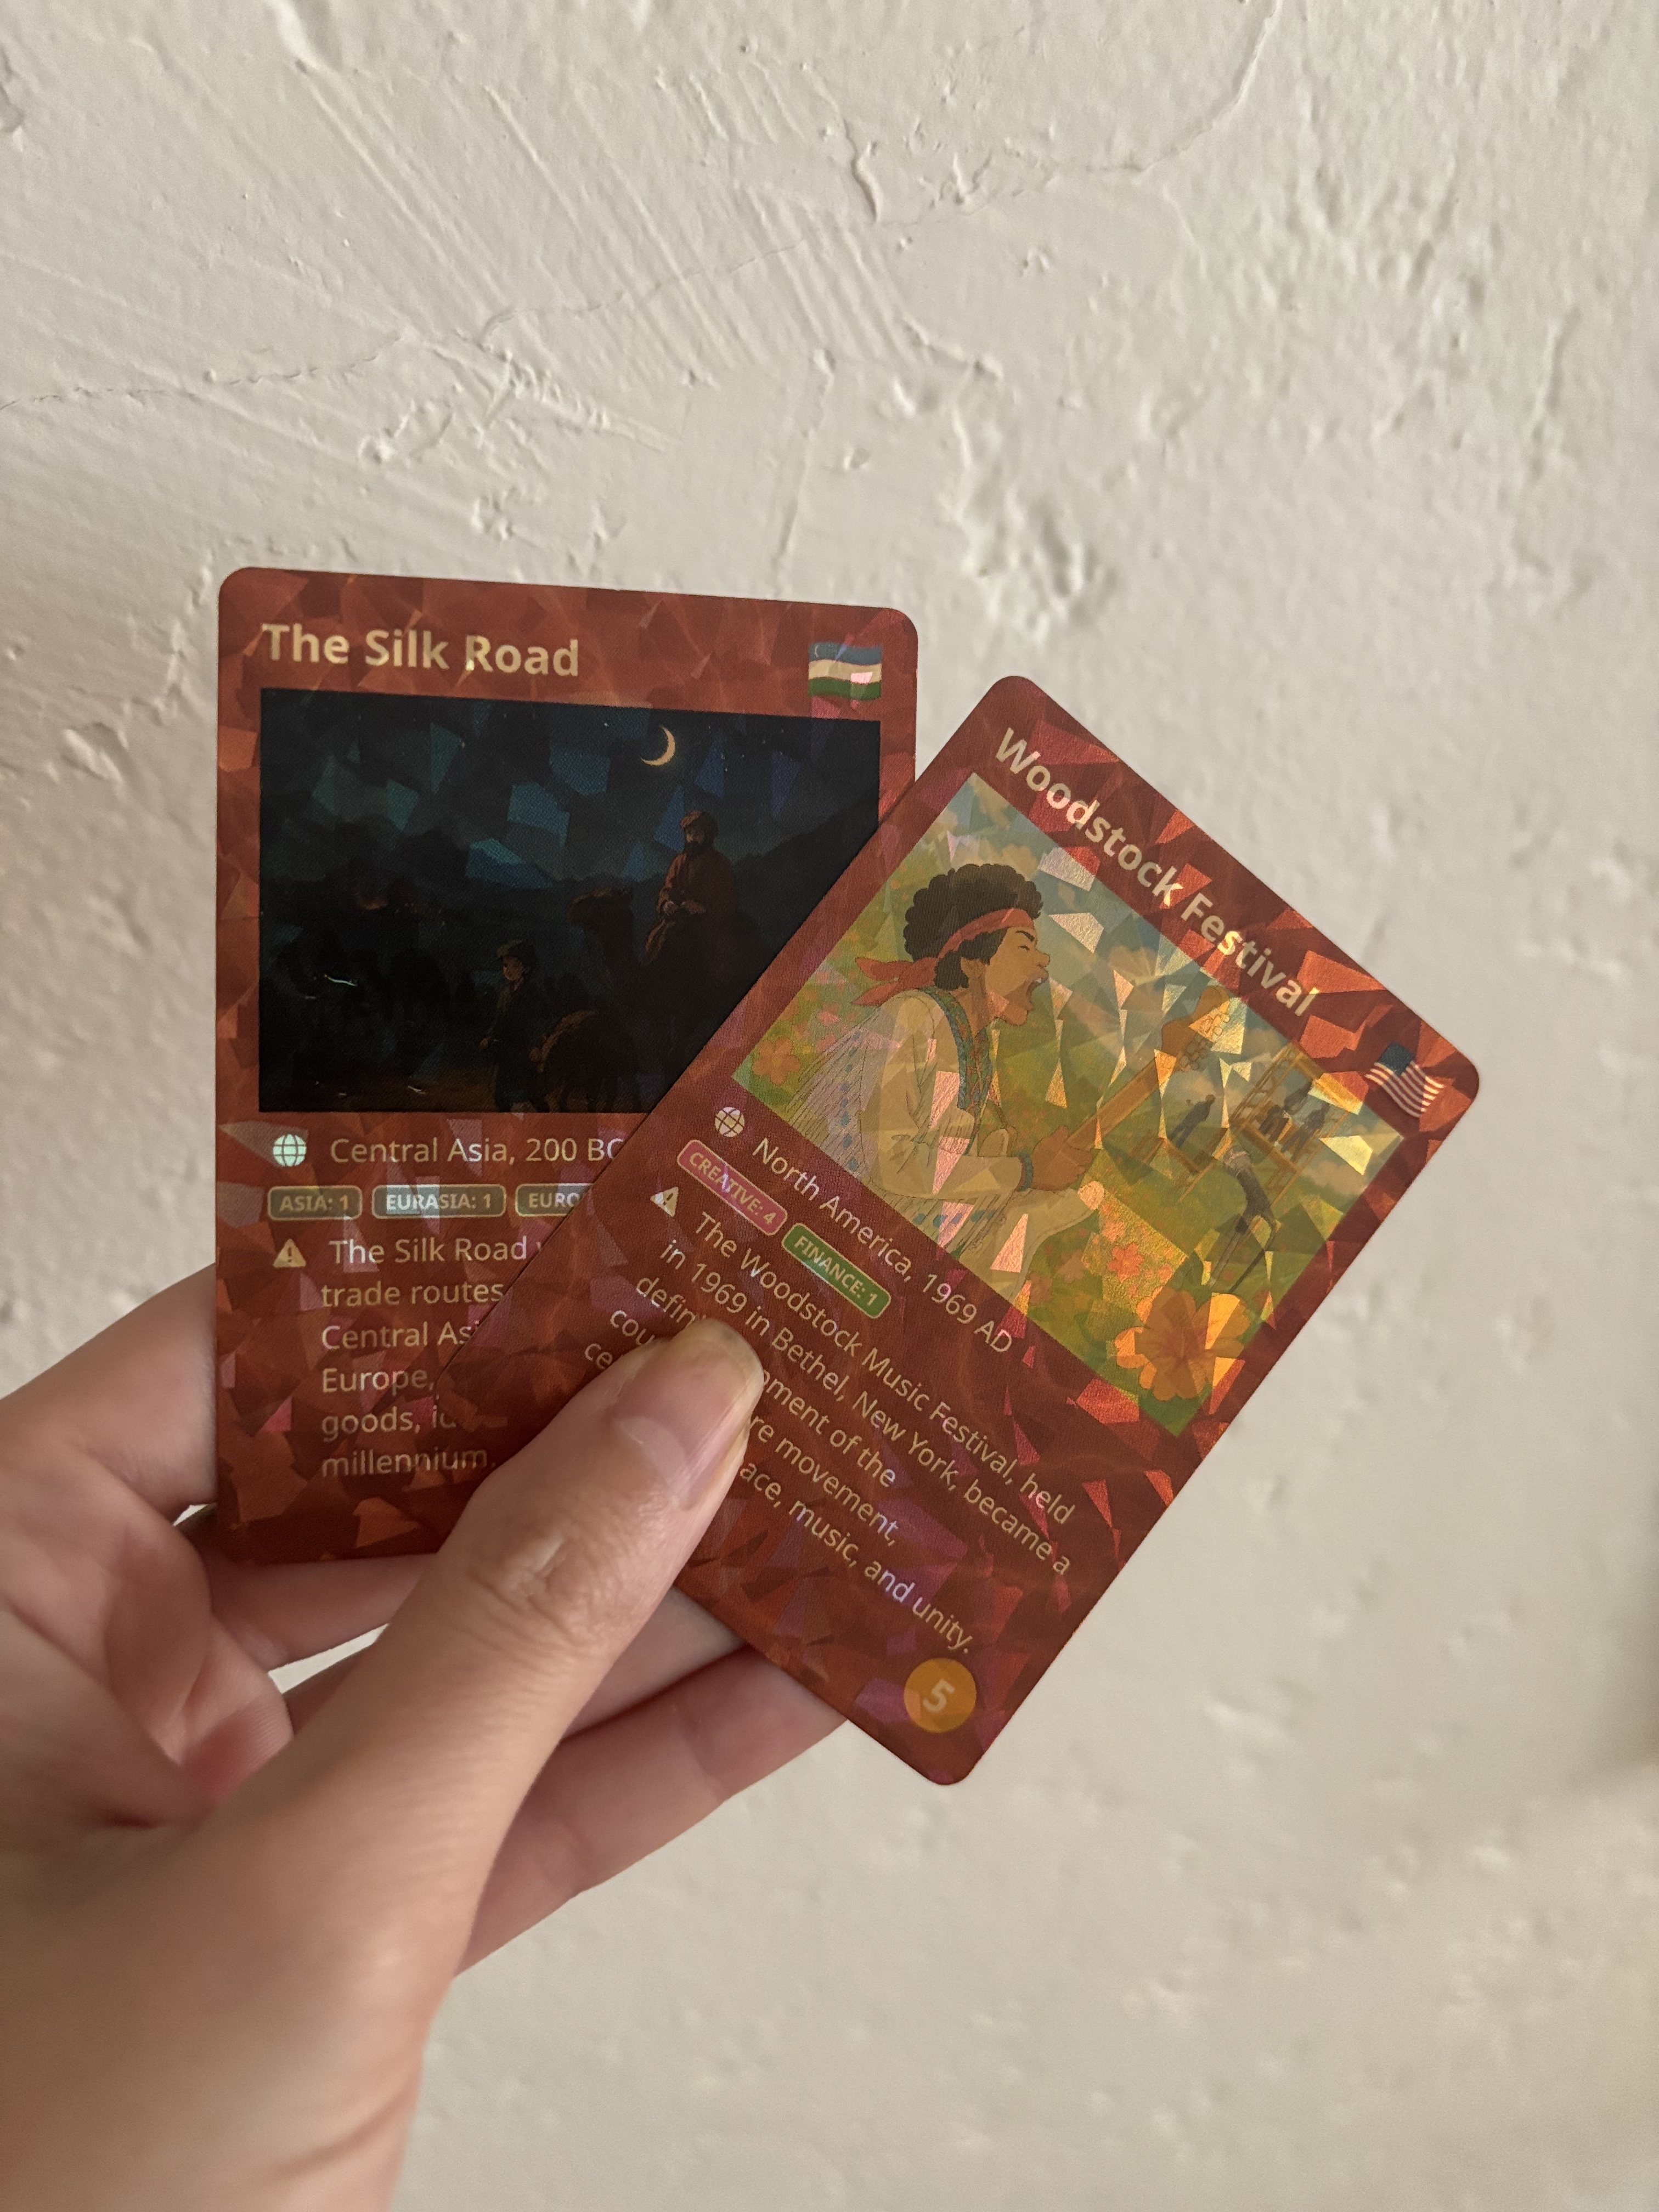
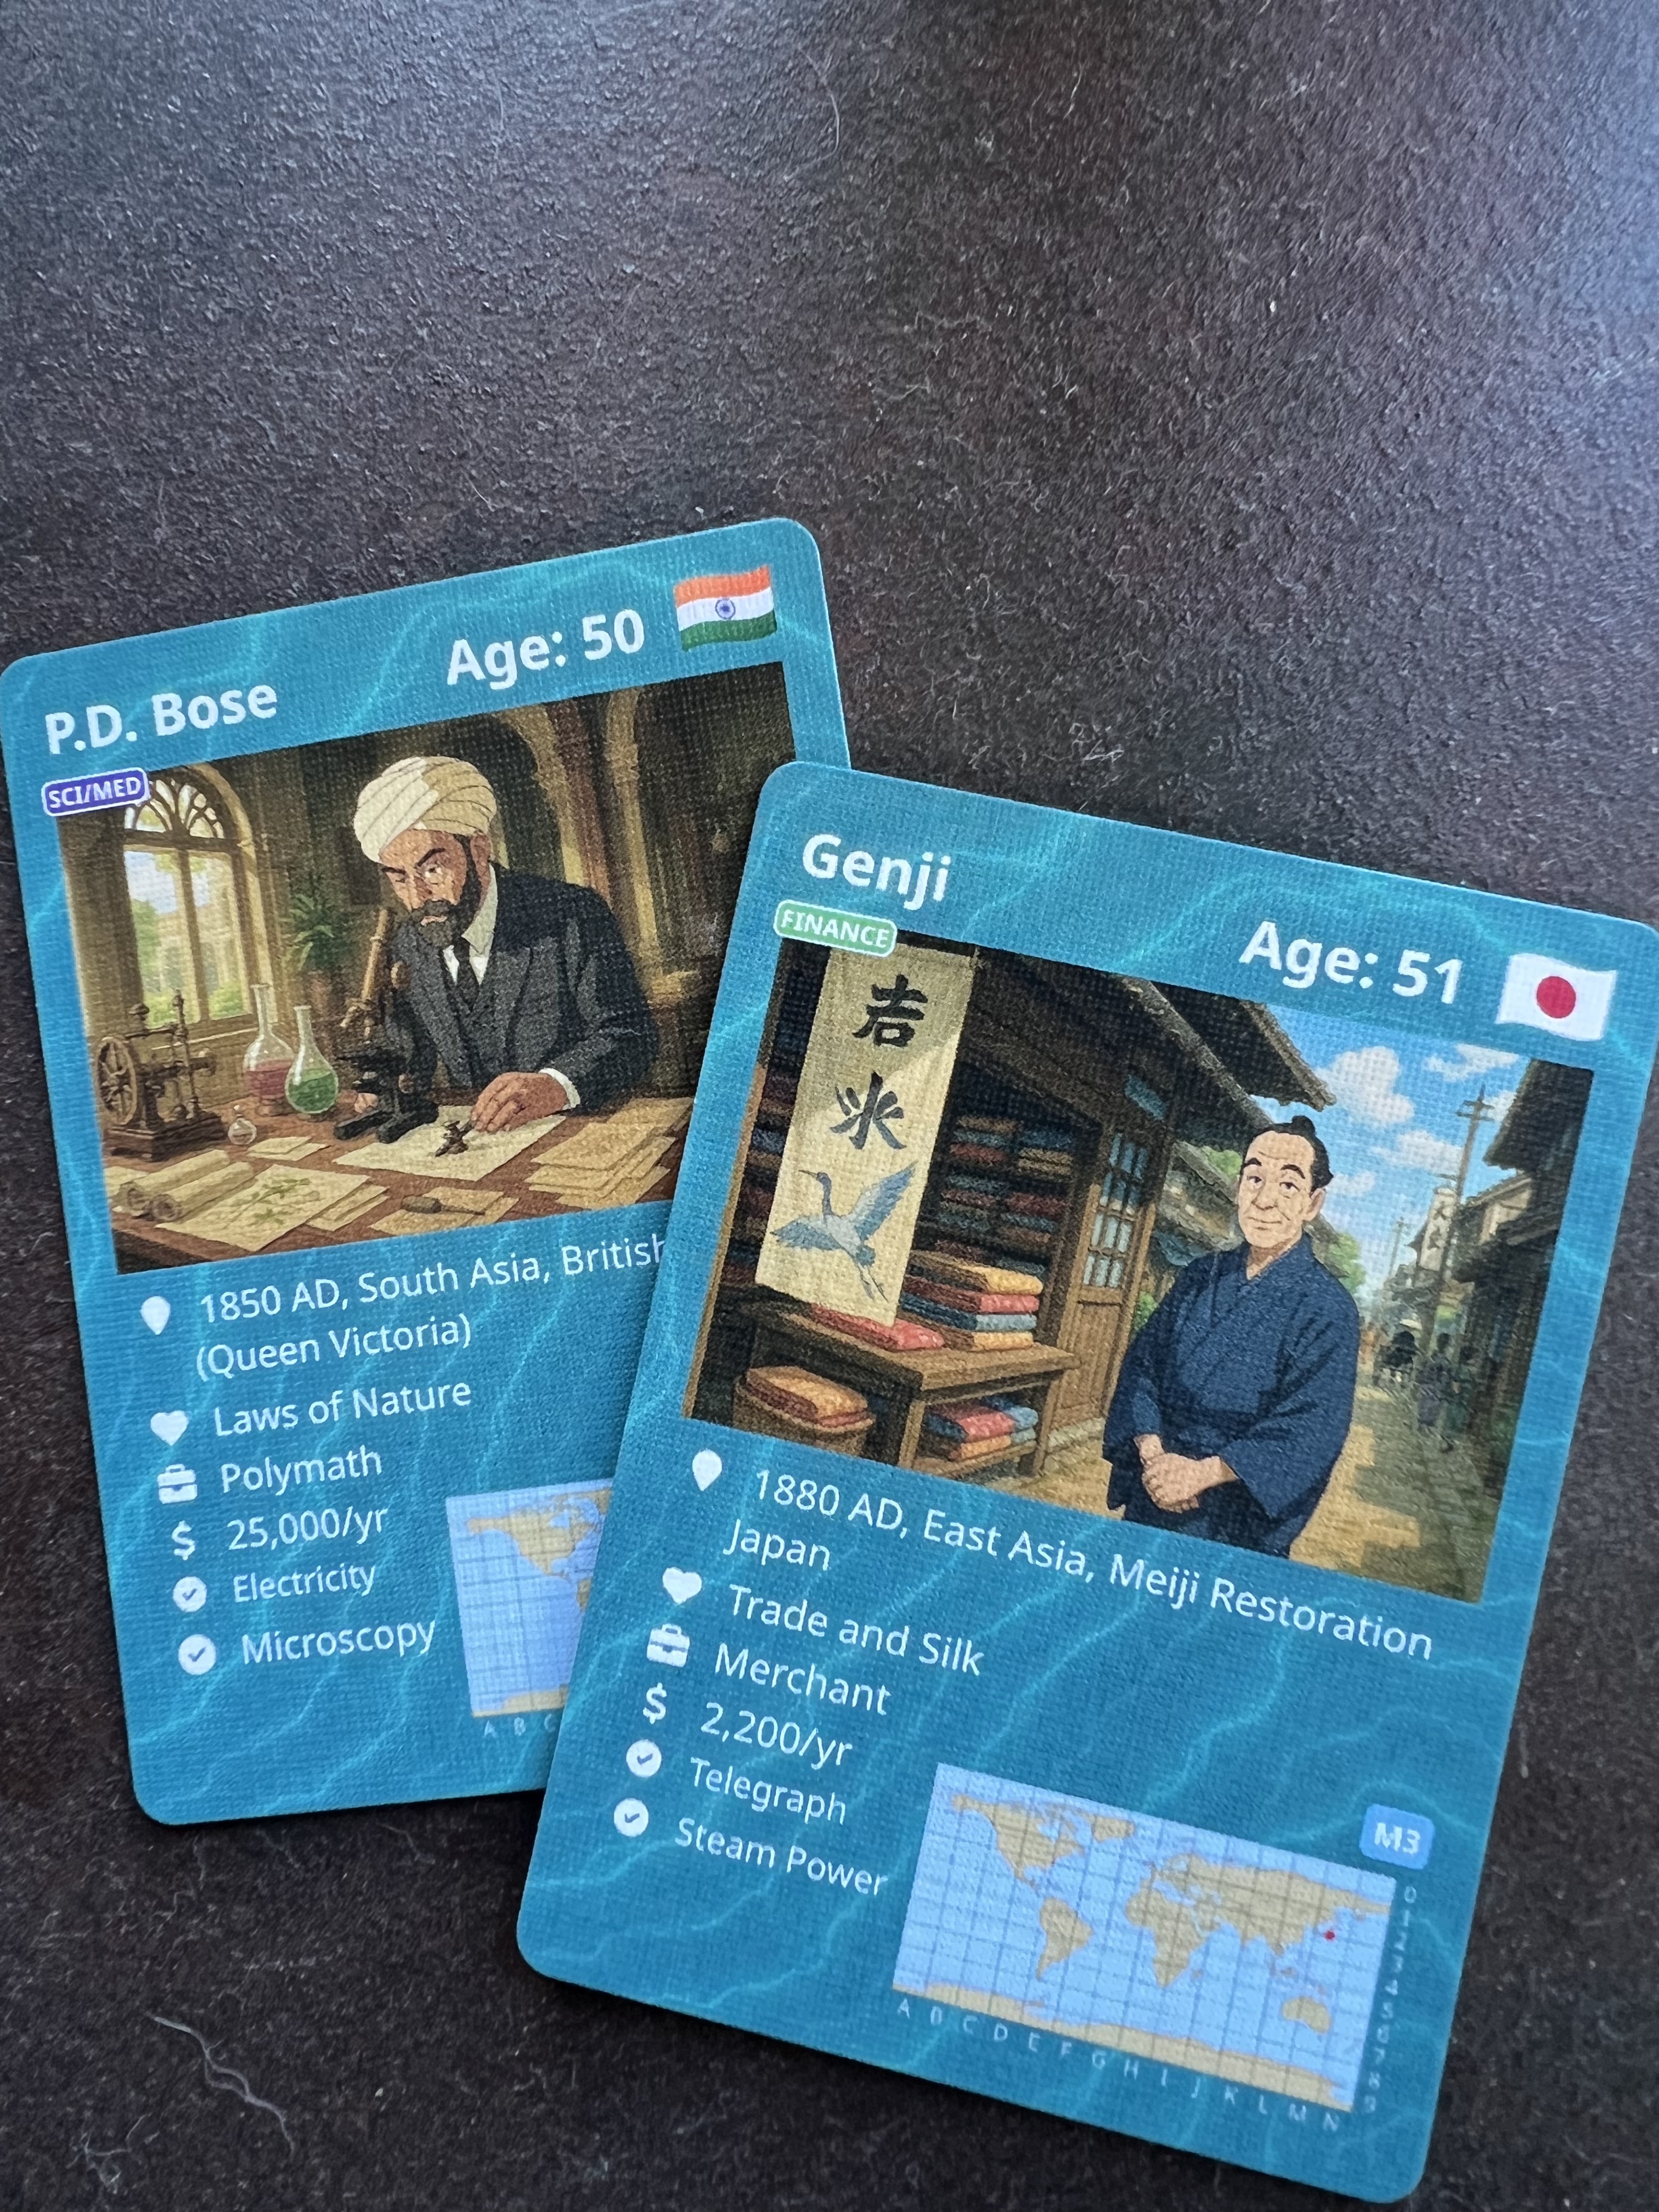
// Recursively fetch articles from a category and its subcategoriesasync function fetchCategoryArticles(category, limit = 100, depth = 2, visited = new Set()) { if (depth < 0 || visited.has(category)) return []; visited.add(category); const apiUrl = `https://en.wikipedia.org/w/api.php?action=query&list=categorymembers&cmtitle=Category:${category}&cmlimit=${limit}&format=json`; const response = await fetch(apiUrl); const data = await response.json(); const members = data.query.categorymembers;{ id: "american_wild_west_1870", name: "American Wild West", year: 1870, region: "North America", countryCode: "US", // United States description: "The American Wild West during the late 19th century, known for cowboys, frontier towns, gold rushes, and interactions between settlers and Native Americans.", demographics: { ageDistribution: { age0to14Percent: 35, age15to64Percent: 60, age65upPercent: 5 }, genderRoles: "Patriarchal, but women played key roles in homesteads and some towns", literacyRate: 80, }, occupations: [ "cowboy", "miner", "rancher", "sheriff", "outlaw", "shopkeeper", "homesteader", "Native American leader", "railroad worker", "schoolteacher" ], interests: [ "horse riding", "shooting", "gambling", "storytelling", "gold prospecting", "dancing", "trading", "rodeo", "campfire cooking" ], technology: { electricity: false, internet: false, writing: true, printing: true } { id: "vandal_germania_400", name: "Vandal Tribes in Germania", year: 400, region: "Central Europe", countryCode: "DE", // Germany description: "The Vandals were a Germanic people living in the forests and plains of Germania during the late Roman Empire. Known for their fierce warrior culture, tribal councils, and migrations, they clashed with Roman legions and other tribes. Life was marked by hunting, raiding, feasting, and storytelling around the fire. Villages were ruled by chieftains, and society was patriarchal, with women managing homes and resources. The Vandals practiced pagan rituals, revered their ancestors, and relied on skilled blacksmiths and horsemen. Their reputation as formidable opponents was cemented in Roman accounts and popularized in stories like the opening of 'Gladiator.'", demographics: { ageDistribution: { age0to14Percent: 45, age15to64Percent: 50, age65upPercent: 5 }, genderRoles: "Patriarchal, warrior aristocracy, women managed households and resources", literacyRate: 1, }, occupations: [ "warrior", "chieftain", "farmer", "hunter", "blacksmith", "artisan", "merchant", "priest", "storyteller" ], interests: [ "raiding", "feasting", "storytelling", "horse riding", "hunting", "pagan rituals", "crafting", "ancestral worship" ], technology: { electricity: false, internet: false, writing: false, swordsmithing: true, blacksmithing: true, horsemanship: true, woodcraft: true }Once we have interesting people—both historical and modern—the next step is making them fun to hold, look at, and play with. We use the OpenAI API to generate each person’s name, interests, and story based on their age, occupation, location, and era. Then a second API call produces an image that matches all those details. The result is a card that’s not just data—it’s a small, coherent character with a name, a backstory, and a visual identity. Kids and adults alike can pick it up, enjoy the graphics, and start imagining the worlds these people inhabit, past and present.
One thing we haven’t fully solved yet is representing income. For modern people, it’s relatively straightforward, but historical figures are trickier—there’s a lot of fuzzy math involved. We’ve tossed around ideas for future versions, like measuring earnings in ounces of gold per year instead of translating everything into modern dollars. It’s a small detail, but it highlights the tension between accurate data and playful representation. Beyond the people, the cards also teach about the world. Every card has a small map in the bottom right corner showing the location, and kids (and adults) can start recognizing countries, flags, and where different cultures existed. The cards also encode technology available to each person: not everyone has electricity or internet today, and in the past, access to longships, papyrus, or other tools varied widely. It’s a way to make geography, history, and technological development tangible while still keeping the game playful.
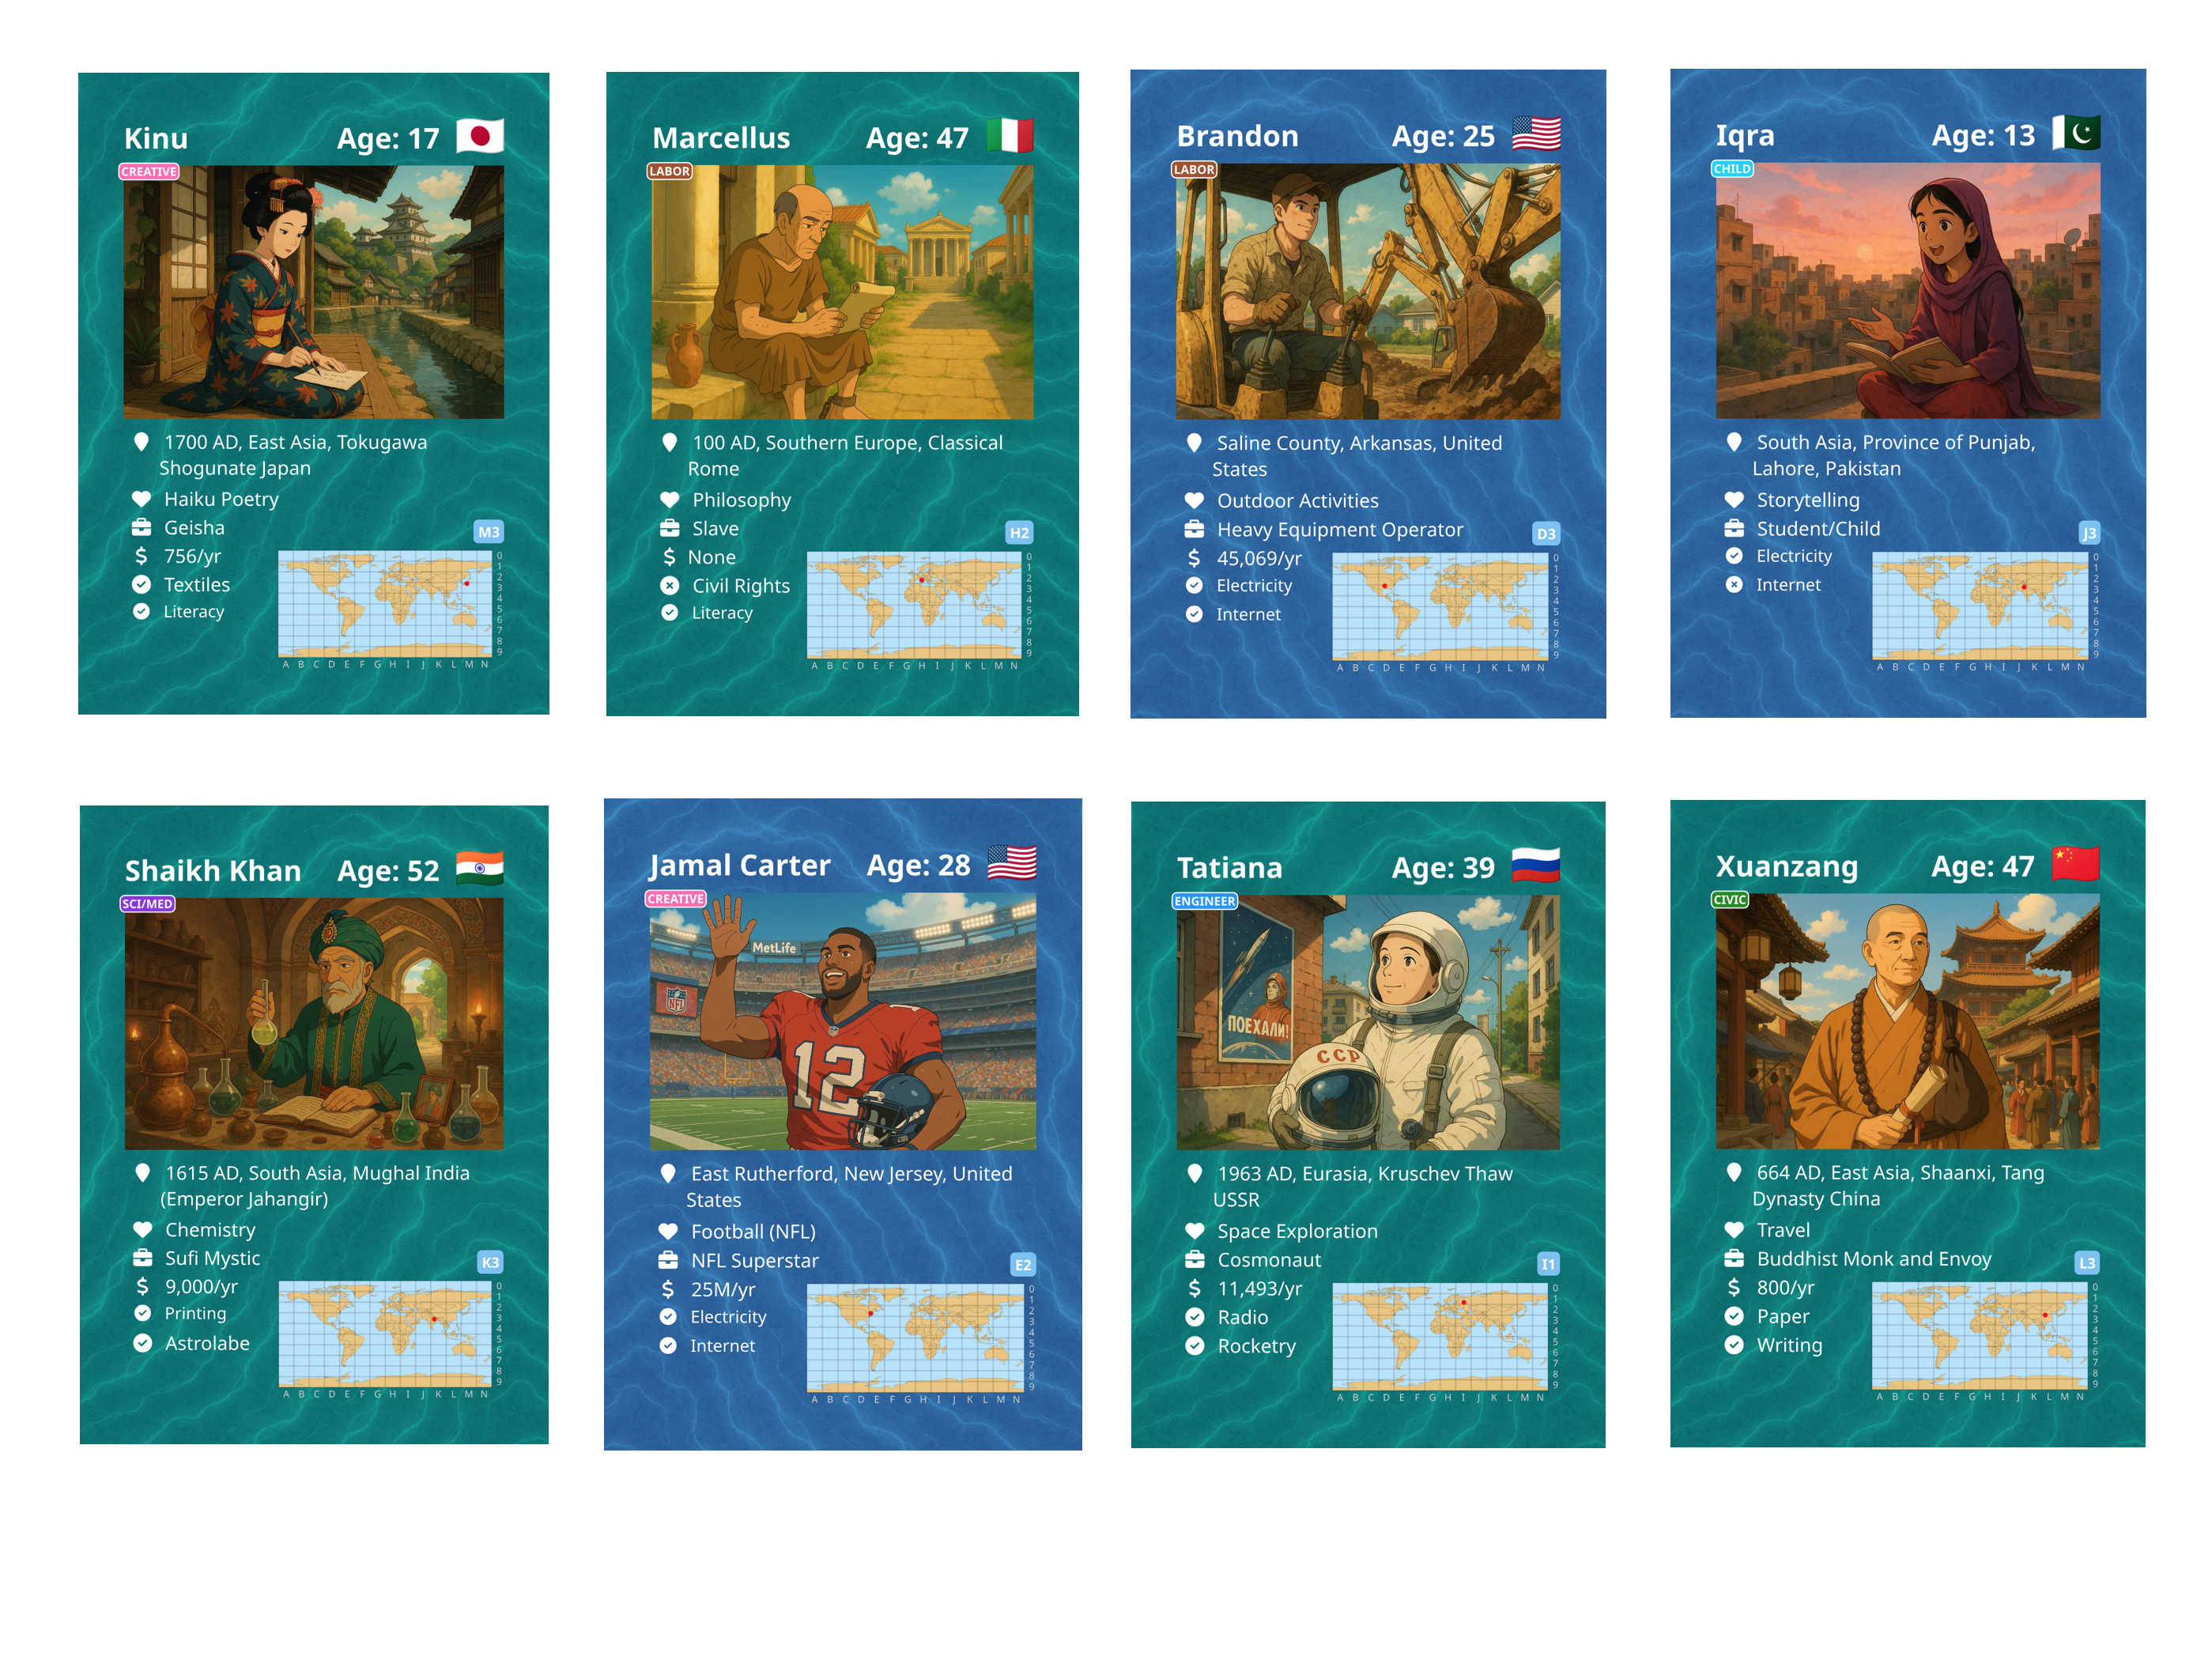
So far, we’ve mostly been talking about trading cards—people from different times and places, like a historical Pokémon. But what makes it a game? Keeping it simple enough for kids was key. I started sharing cards with teachers and administrators at my kid’s school, and we wanted something that’s easy to pick up and fun for adults, too. That led us to a new class of cards: event cards. Each event card has a number of victory points, and players win it by meeting requirements that are satisfied by the people cards in their hand. It’s open-ended and flexible, but it gives structure without overwhelming players.
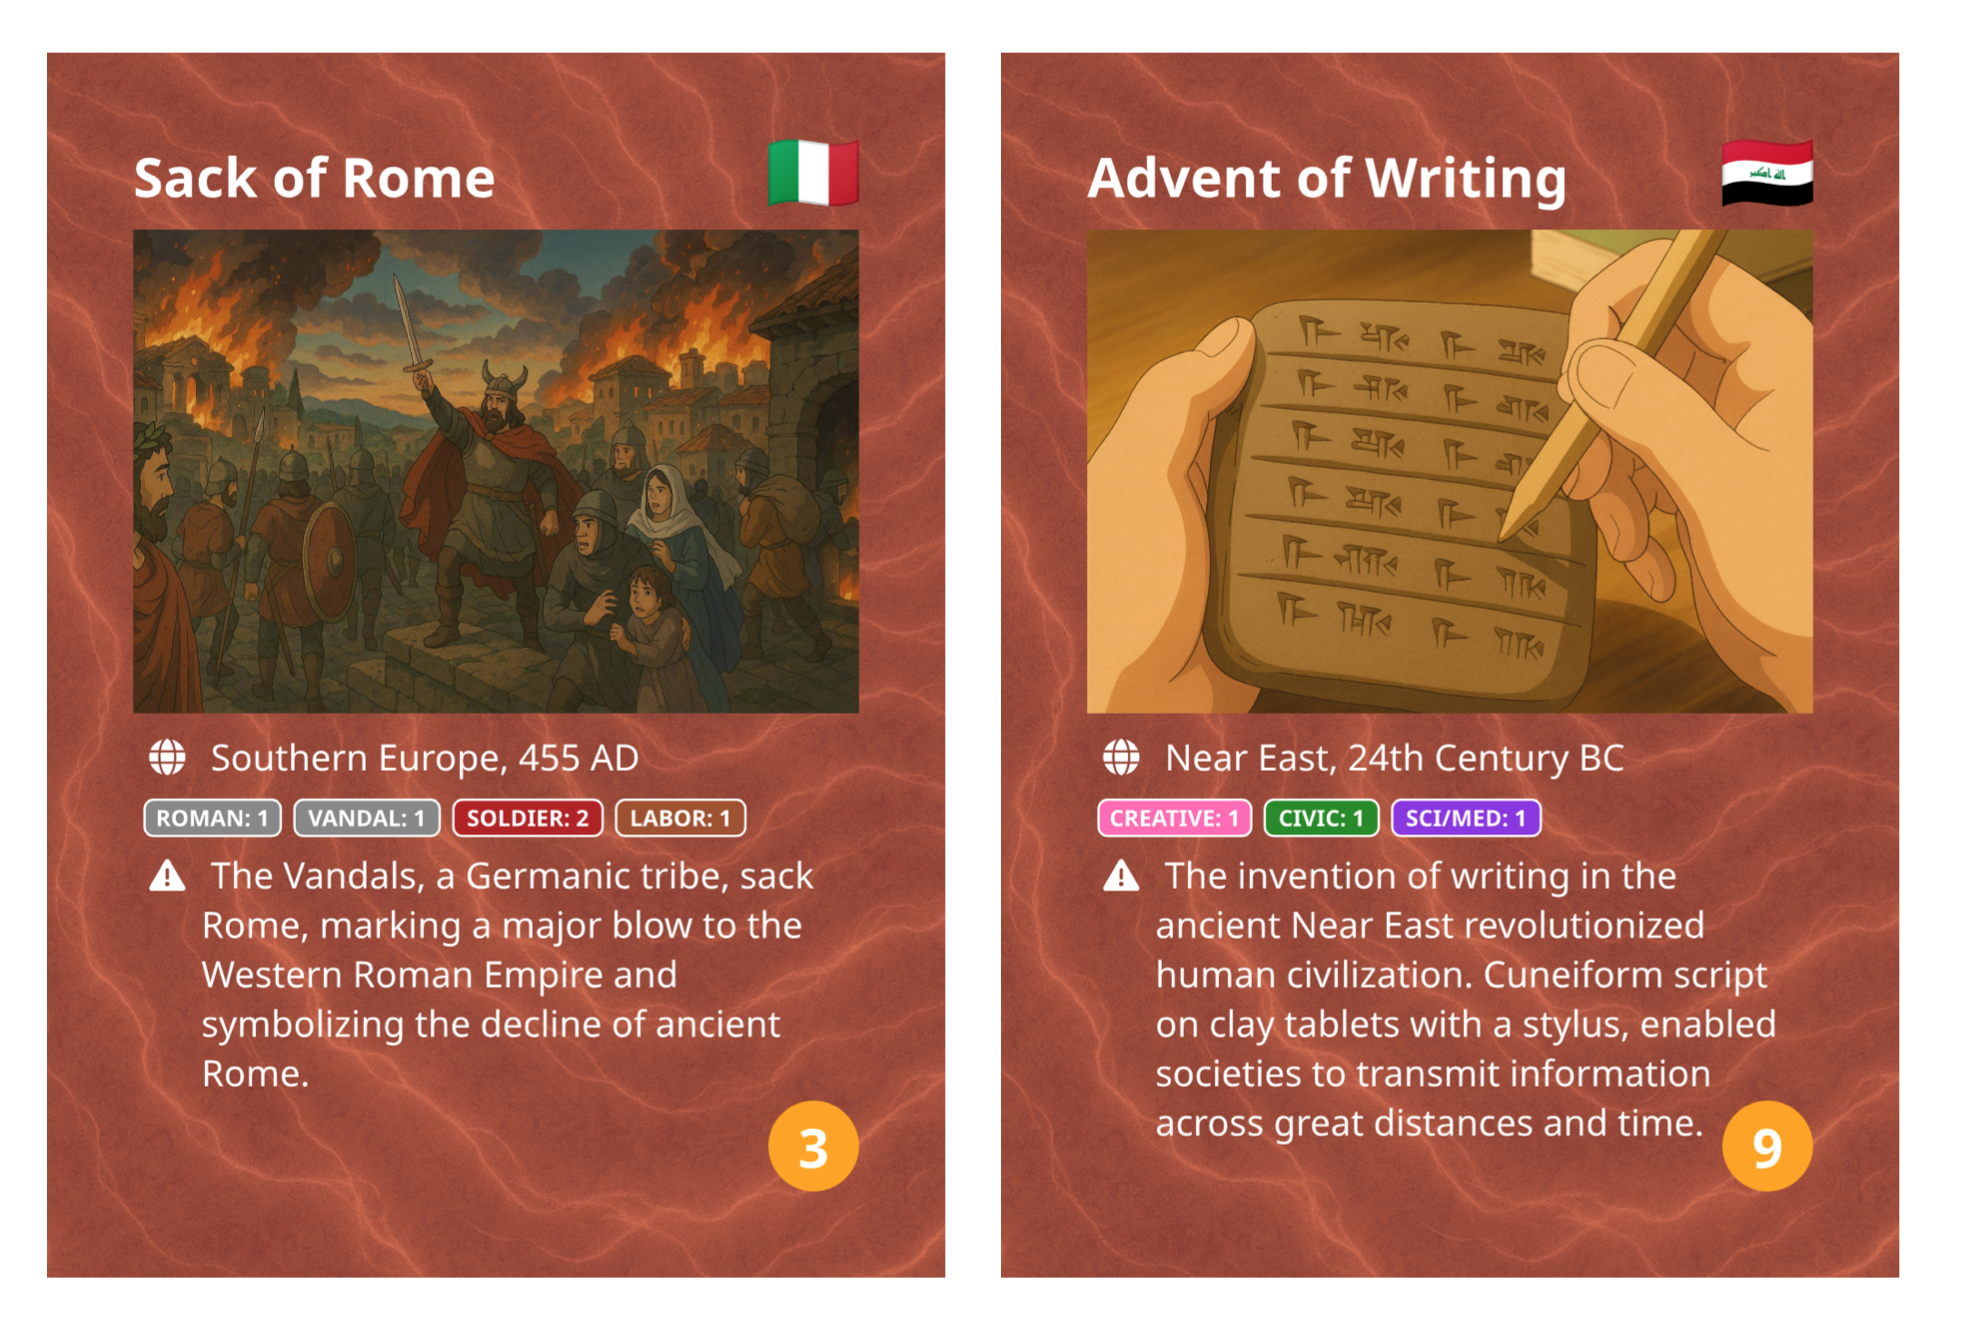
On each event card, just below the image, location, and time, you’ll see a few colored rectangles with numbers labeled “civic,” “soldier,” “labor,” or similar. These are the requirements needed to win that card. Every person card—historical or modern—is stamped with one of these classes: engineers, finance, government, children, retirees, etc. Children and retirees introduce interesting gameplay dynamics. In the current model, a child can be raised into any class needed to meet an event card’s requirements, but it takes three turns. Retirees either get discarded or could accelerate raising a child, reducing it from three turns to one. It’s still open-ended, but these mechanics let us connect people to events in simple, strategic ways.
Supported Flags / Command Line OptionsThese scripts support the following flags:program1_sample_positions.js--places=<place1,place2,...>Filter sampled positions to preferred places (by name, region, or description).program2_sample_people.js--historical-onlyOnly generate historical people (from eras in historical_eras.js).--modern-onlyOnly generate modern people (no era field).A natural question is what happens if you sample the world “honestly.” Wouldn’t you just keep generating people from India and China today, or endless farmers in the past, or office workers on laptops if you zoom into the Bay Area? In practice, that’s exactly what naïve sampling gives you. The workaround is simple but powerful: command-line flags. Instead of sampling the entire planet, you can constrain the distribution—only sample New Zealand and Greece, tilt the mix toward historical or modern people, restrict to certain classes, or even specific eras. The system can still do pure random sampling, but these controls turn it into something more like a telescope or a microscope. You’re not choosing the person, just where and how closely to look.
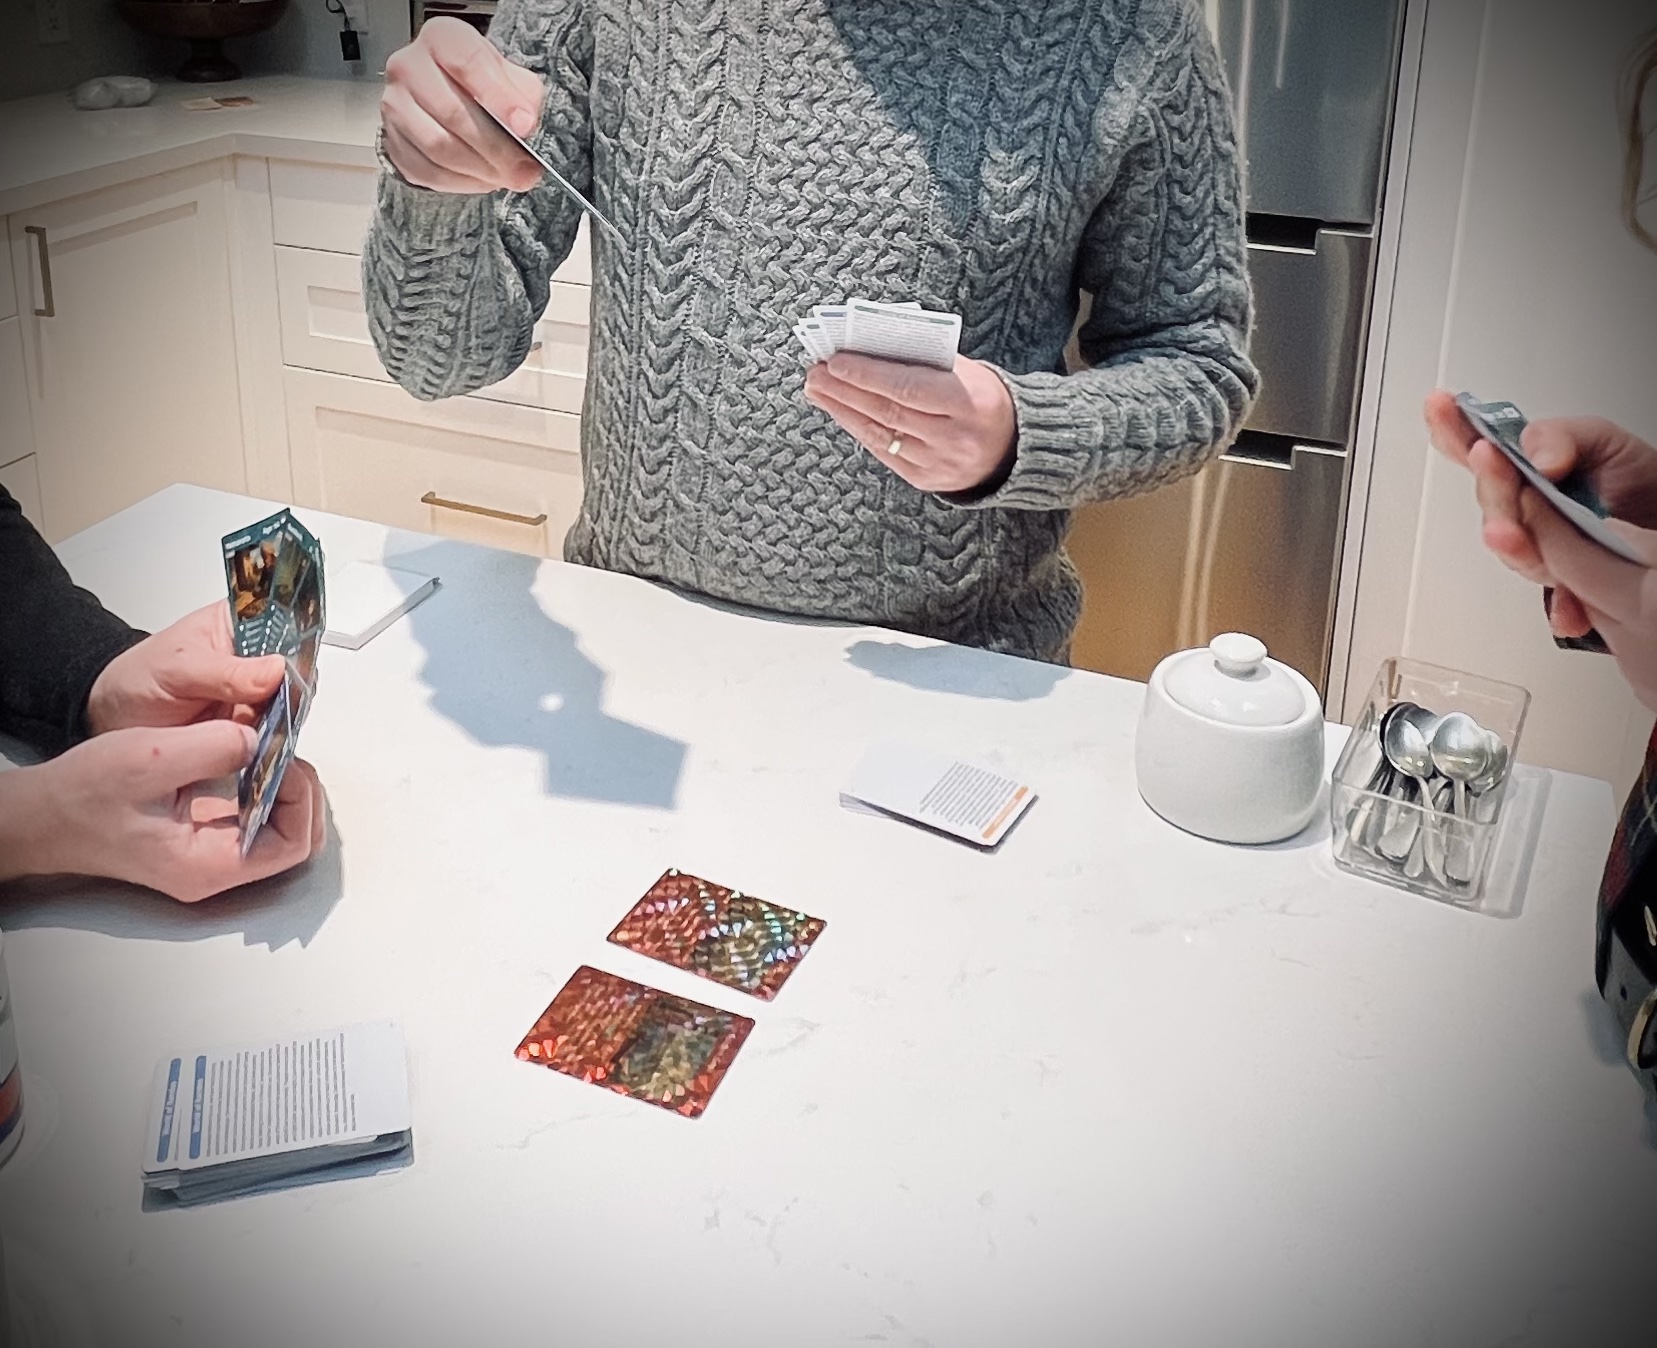
So what’s it like to actually play the game right now, and did it meet our goals? The mechanics are still evolving. The core loop is simple, but one clear piece of feedback is that we should lean harder on the data already on the cards—things like economy, interests, and age, which right now only really matter for children. There’s a lot of room to build mechanics that make those fields meaningful. Even in its current form, though, the game is genuinely fun. We’ve played it with groups of friends, with and without kids, and people get into it quickly. Games move fast, and it doesn’t feel heavy or didactic.
As for the original motivation—helping kids form a clearer picture of the world—it’s not a silver bullet. This isn’t going to solve social cohesion or prevent us from sliding into some Mad Max future. But it does encourage a less aggressive, more cooperative way of thinking about people, across time and place. It shows that societies, cultures, and regions ebb and flow, and that history isn’t a snapshot—it’s a process. For us, as parents and builders, that felt like a worthwhile outcome.