Continuing from the previous post[1], dealing with structural effects of variants, we can now abstract one more level up and investigate our sequencing results from a relational pathway model.

Global Metabolic Pathway Map of H.sapien by Kanehisa Laboratories
The Kyoto Encyclopedia of Genes and Genomes (KEGG) has become an indispensable resource which has laboriously, and often manually, curated high-level functions of biological systems. Bioconductor, though not as essential as KEGG, provides some valuable tools when utilizing graph-theory for genomic analysis. If your data is well annotated and you happen to care about high-level genomic interactions, then you may have pathway annotations, containing data like the following:
KEGG=hsa00071:FattyAcidMetabolism;

KEGG=hsa00280:Valine,LeucineAndIsoleucineDegradation;

KEGG=hsa00410:betaAlanineMetabolism;
KEGG IDs can be stored on an external file separate from the sequence data they are derived from. Though, storing the IDs with their respective variant is helpful, and it is possible to maintain VCF 4.1 specifications.

KEGG Annotations in VCF 4.1
As most Bioconductor tools are based on the R programming language, having an updated installation is recommended, this post uses version 3.0.1 “Good Sport”. Creating interaction maps with KEGG data will require three packages: KEGGgraph, Rgraphviz, and org.Hs.eg.db. These packages can be downloaded as separate tarballs, however installation from within R is likely best:
$R

source("http://bioconductor.org/biocLite.R")

biocLite("KEGGgraph")

library(KEGGgraph)
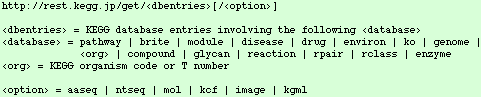
Using the method above for all three. KEGG relational information is stored within XML files in the KEGG Markup Language. KGML files can be accessed through several methods, including directly from R, FTP, and subjectively the best method with REST-style KEGG API.
Bioconductor packages downloaded above come with a few KGML files pre-loaded, which can be viewed with the following command, it is also important to note that KGML files we want to use should be placed in this directory to avoid any unnecessary errors.
$R

dir(system.file("extdata",package="KEGGgraph"))

$../Resources/library/KEGGgraph/extdata/
In this post the branched-chain amino acid (BCAA) degradation pathway, which has a KEGG ID of hsa00280, will be mapped in relation to variants from the BCKDHA gene.
$R

[var1] <- system.file(".xml",package="KEGGgraph")

[var2] <- parseKGML2Graph([var1], genesOnly=TRUE)

[var3] <- c("[KEGG-Gene-ID]",edges([var2])$'[KEGG-Gene-ID]')

[var4] <- subKEGGgraph([var3],[variable2])

[var5] <- sapply(edges([var4]), length) > 0

[var6] <- sapply(inEdges([var4]), lendth) > 0

[var7] <- [var5]|[var6]

[var8] <- translateKEGGID2GeneID(names([var7]))

[var9] <- sapply(mget([var8],org.Hs.egSYMBOL),"[[",1))

[var10] <- [var4]

nodes([var10]) <- [var9]

[var11] <- list();

[var11]$fillcolor <- makeAttr([var4],"[color]")

plot([var10], nodeAttrs=[var11])
Executing these steps will result in a graph whose nodes and edges should help clarify any relevant connections between the genomic regions in question.

Results
While dynamic visualization tools (e.g. Gephi, Ayasdi, Cytoscape) look similar, and with some work utilize KEGG, they may lack the specificity and control which Bioconductor provides due to its foundations in R. These methods are necessary to understand more than just metabolic diseases, they also play a crucial role in drug interactions, compound heterozygosity/complex non-mendellian traits, and other high-level biological functions.